You can create custom reports and classify these reports into categories. The reports are generated by writing SQL queries and can be exported to excel sheet.
You can create reports under a new or existing category.
To create categories, follow these steps:
- Go to Application Menu > Miscellaneous > Reporting Manager.
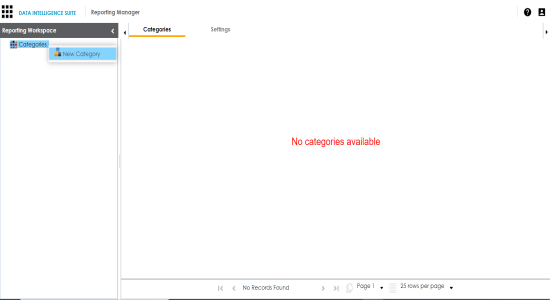
- Right-click the Categories node.
- Click New Category.
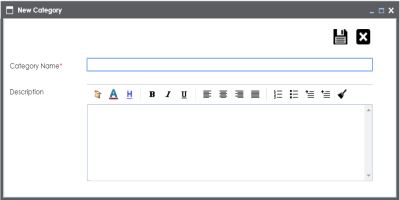
- Enter Category Name and Description.
- Category Name - Workflow_Status
- Description - The category contains workflow related reports.
- Click
 .
.
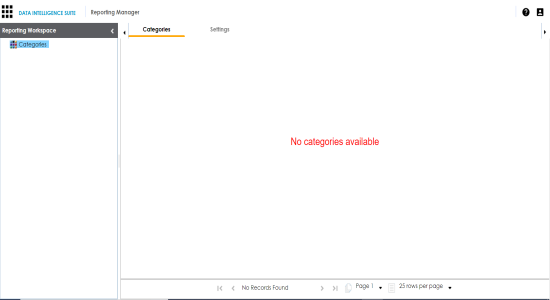
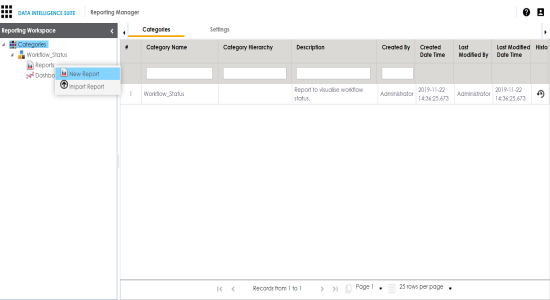
The following page appears showing the Categories node.
The New Category page appears.
For example:
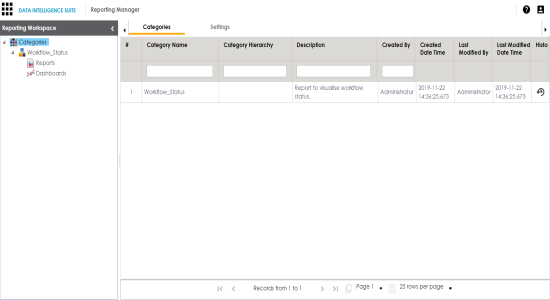
The category is created and saved in the Categories tree.
To create a report, follow these steps:
- Expand the desired category node.
- Right-click the Reports node.
- Click New Report.
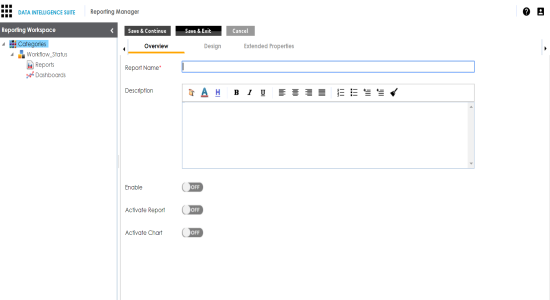
- Enter Report Name and Description.
- Report Name - Workflow_Assignment
- Description - This report is about the workflow assignment to users.
- Click Save and Continue.
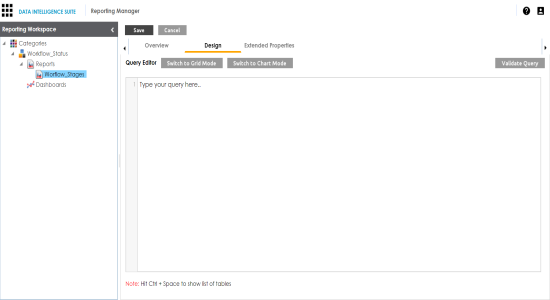
- Write a suitable SQL query and use Ctrl + Space to get the list of tables.
- Click Validate Query to validate the query.
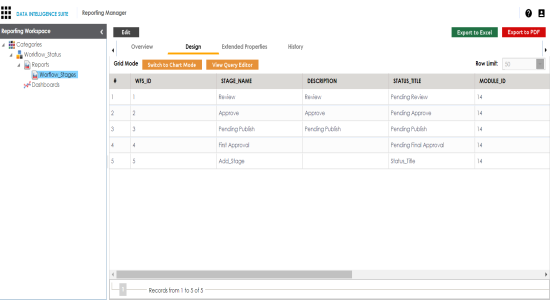
- Click Switch to Grid Mode to view the report in grid view.
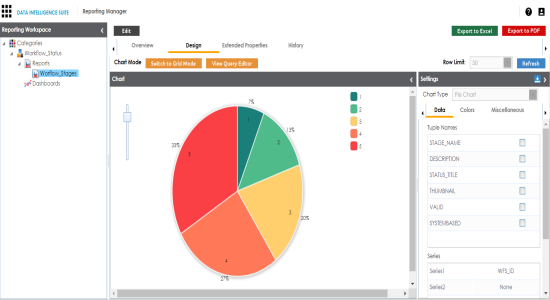
- Click Switch to Chart mode to view the report in chart mode.
- Click Export to Excel to download the report in .xlsx format.
- Click Export to PDF to download the report in .pdf format.
The following page appears.
The following page appears.
For example:
The report is created and saved in the Reports tree.
By default, the Design tab opens.
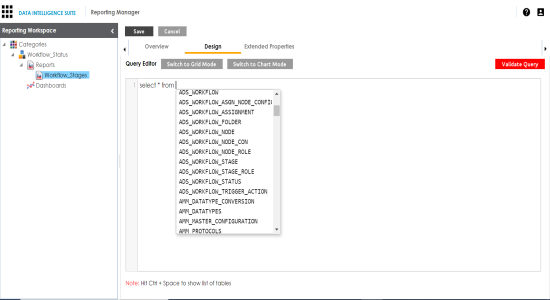
The query is validated.
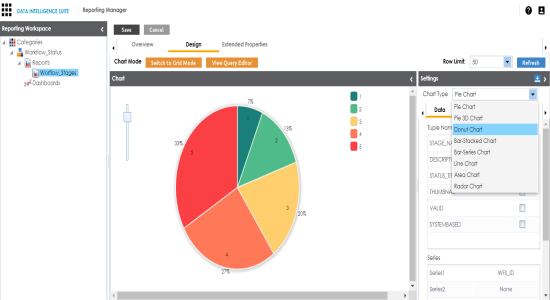
To view the report in a different chart type, follow these steps:
- click Edit.
- In Settings tab, select the appropriate chart type and click Save.
To enable and activate the report, follow these steps:
- Click Edit.
- Click the Overview tab.
- Turn the Enable switch to ON.
- Turn the Activate Report switch to ON.
- Click Save.
- To activate chart, turn the Activate Chart switch to ON and click Save.
The following page appears.
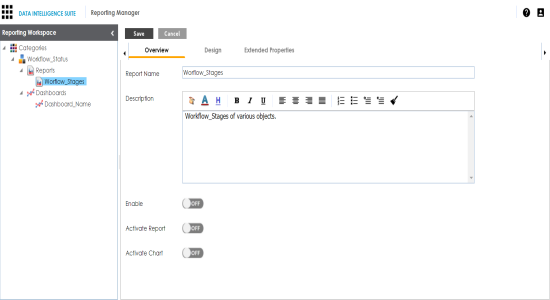
The report is enabled and activated.
Note: Only, an enabled and activated report can be added to a dashboard.
Note: Only, an activated chart can be added to a dashboard.
|
Copyright © 2020 erwin, Inc.
All rights reserved.
|
|